

I’ve always liked Sankey diagrams, specially for visualizing break down of costs and budgets. The way it shows the flow of values is very intuitive and easy to understand. Recently I discovered a new use for it, I learned from Hrishikesh Patel that you can use it to visualize confusion matrices. Check the image below for a cool example.
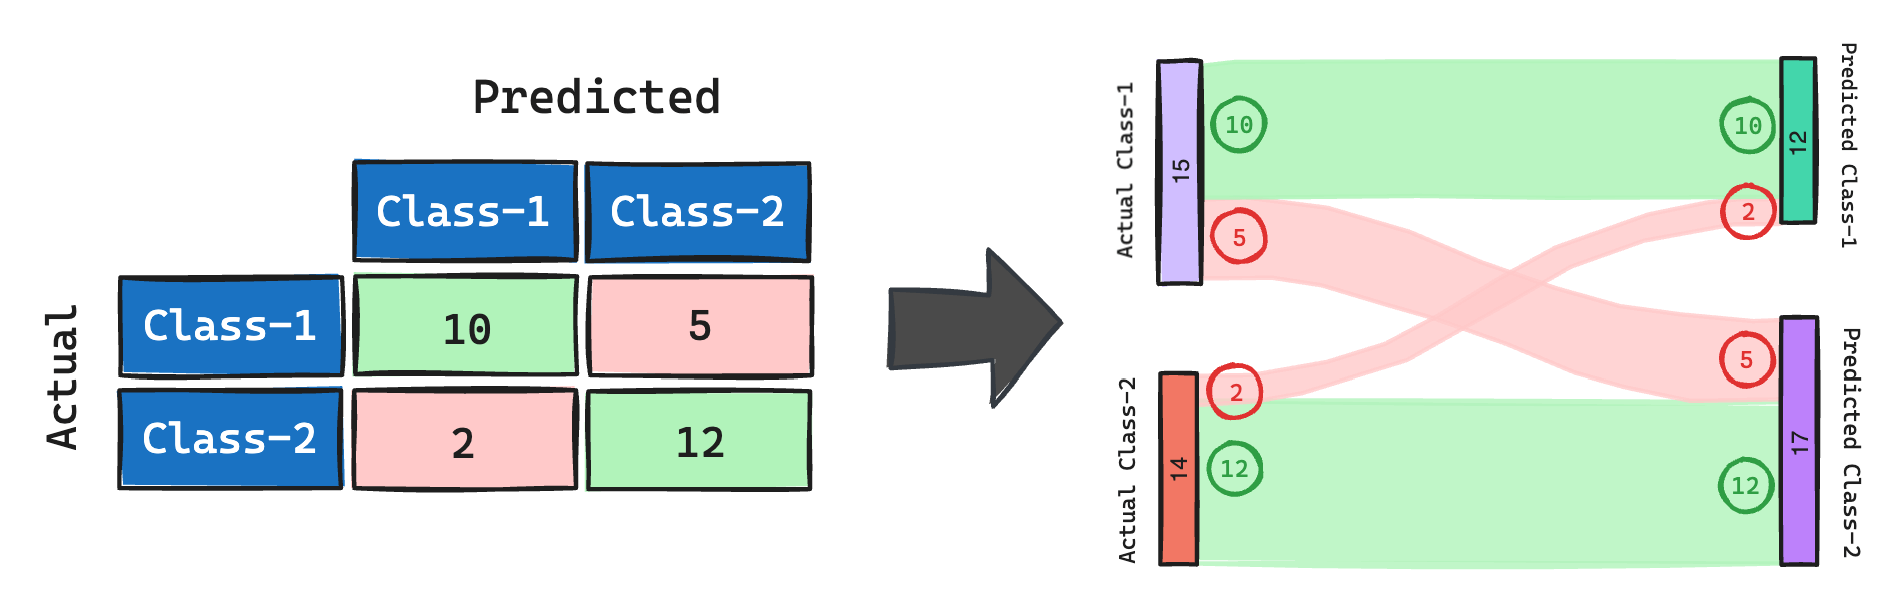 Representing a confusion matrix using a Sankey diagram. Based on Hrishikesh Patel’s diagram.
Based on that I thought, what else would it be possible to visualize with Sankey diagrams? Well, I didn’t find something nice yet, but I created an app that allows everyone to create Sankey diagrams without having to code. Now I hope that people more creative than me can come up with new uses for it 😄.
How the app works
The app is quite simple. Its main components are a table where the user can insert and edit the data and a diagram which is rendered every time the user makes a change in the table.
To make it simpler for the users to get started, I’ve added a sample data which is pre-loaded when the app starts. The users can use it to quickly get to know the app’s interface and see how the diagram changes when tweaking the data oe the configurations.
Once the users are ready to insert their data, they do that by adding the rows line by line, or more conveniently by uploading a CSV file containing the columns source, target and value. A new diagram will appear automatically after the file is uploaded.
If you want to see all the features in action, check out the video below.
You can also test it yourself by clicking on ➡️ ![]()
Lessons learned from this project
Project structure
To bootstrap the project, I’ve used a cookiecutter template poetry-cookiecutter. It is very easy to use it, but some questions asked during the setup could be improved, e.g. continuous_integration forces the use of GitHub Actions or GitLab CI. Sometimes I don’t want setup a CICD, for example on this project, where Streamlit Cloud takes care of deploying the app from the GitHub’s repository.
The main lesson learned from using the poetry-cookiecutter for me is the integration with the task runner Poe the Poet. It was the first time I’ve used it, and I can see myself using it in my future projects to replace Makefiles.
Streamlit
I’ve learned a few things since my last project. I finally understood how to use the st.empty() method to update the widgets’ contents dynamically. I used this feature to render the Sankey diagram without having to reload the whole page.
Show me the code!
You can find below the full code of the Streamlit app. If you want to see the full project, check out the GitHub repository.
You can also fork the App directly here ➡️ ![]()
Conclusion
So, that’s it! I hope you enjoyed this post and the app. If you have any suggestions or ideas for new features, please let me know in the comments below or send me a DM on Linkedin.


